Renewable Energy in Texas Soars!

This summer, Texas needs every available megawatt to power our grid and renewable energy generation continues to reach new heights in ERCOT, providing us with reliable, affordable power.

On June 17th, ERCOT hit a new wind generation record with 27,849 MW generated across the state. The following day, wind generated 27,202 MW of energy for the Texas grid, coming in at #3 for all-time wind generation.

On June 18th, ERCOT hit a new renewable generation record with 37,946 MW generated across the state.

On June 22nd, ERCOT hit a new solar generation record with 19,287 MW generated across the state.

Battery energy storage also continues to break records when the grid needs it most, such as last month during the May 8th Weather Watch issued by ERCOT when a record 3,195 MW of energy from batteries was utilized to fill the gaps brought on by traditional power plant outages that were higher than expected.

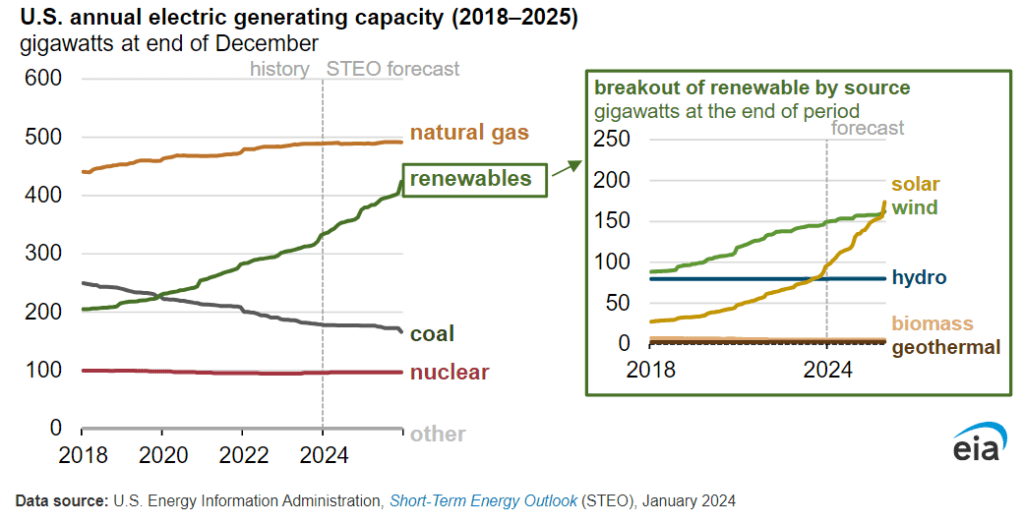
U.S. solar power generation forecast to grow 75% through 2025

The Energy Information Administration expects solar generation to grow from 163 billion kWh in 2023 to 286 billion kWh in 2025.

A recent report from the U.S. Energy Information Administration (EIA) showed strong growth for solar energy and moderate growth for wind energy.

During the period from 2023 to 2025, the EIA expects solar generation to grow 75%. The U.S. generated about 163 billion kWh in 2023, and EIA expects this to reach 286 billion kWh by 2025.

According to PV Intel data, solar power generated 5.78% of U.S. electricity from January to October 2023, an increase of 16% over the previous year.

Wind power generation is expected to grow 11% from 430 billion kWh in 2023 to 476 billion kWh in 2025.

EIA expects coal generation to drop from 665 billion kWh in 2023 to 548 billion kWh in 2025. Natural gas is expected to continue to generate 1,700 billion kWh in 2024 and 2025, making it the largest source of electricity in the U.S. Over the next two years, both natural gas and nuclear power are expected to remain relatively flat in their generation contributions.

In total, the U.S. electric power sector produced 4,017 billion kWh. As a group, renewable energy generation has passed total nuclear generation in 2021 and surpassed coal in 2022. Renewable energy sources include solar, wind, hydroelectric power, biomass, and geothermal.

Increasing renewable energy capacity is driving this shift in generation mix. Solar developers are expected to increase total operating capacity by 38% by 2024. Total solar capacity is expected to increase from 95 GW at the end of 2023 to 131 GW by the end of 2024.

U.S. Energy Information Administration (EIA) estimates utility-scale solar projects larger than one megawatt will have installed 45 GWdc by 2024, which is expected to increase to 53 GWdc in 2025. The total solar power capacity expected for 2024 is 53.5 GW when Wood Mackenzie Power and Renewables conservatively projects 6 GW for residential solar and 2 GW for commercial. According to projected figures, 65 GW of solar power could be installed by 2025.


Tracking Dangerous Heat in the U.S.

Heat index measures how hot it feels outside, accounting for temperature and humidity. Map shows highest level forecast for the day.

Climate Change is real

AUSTIN, Texas — The state climatologist says Texans should brace for more triple-digit days, as well as higher chances for drought, wildfire and flooding over the next decade.

Those are some of the findings in a recently released report predicting climate trends through 2036, the state’s bicentennial.

“The things we know, we can plan for,” Dr. John Neilsen-Gammon, the Texas state climatologist, said during an interview Wednesday from his office at Texas A&M University in College Station. “Things we don’t know, we can allow for different possibilities.”

Nielsen-Gammon was appointed Texas State Climatologist in 2000 by then-Gov. George W. Bush.

Recently, the Texas A&M atmospheric science professor authored an updated report predicting climate trends through 2036. His team analyzed data from 1900 through 2023.

“‘Climate change is real’ is an obvious takeaway,” Nielsen-Gammon said.

He said the rising temperatures are driven by increases in greenhouse gas emissions, and the pace aligns with climate model projections.

“That, obviously, gives us confidence that the changes we’ve seen are actually part of a long-term trend, rather than just natural variability,” Nielsen-Gammon said.

He said the number of 100-degree days in his findings is what surprised him most.

[It] more than doubled since the 1970s and is still increasing,” Nielsen-Gammon said. “So, that the total change is probably going to be quadrupling by 2036.”

The report also predicts more intense rainfall and more flooding in cities.

“Take any flood that you had historically and add 25% more water to it,” Nielsen-Gammon said.

The professor also predicts more evaporation, which would lead to drier vegetation that could become fuel for wildfires.

“Reducing climate change is a global problem, but dealing with climate change is a local problem,” he said.

It’s a problem Austin’s mayor acknowledged during a Tuesday news conference on heat safety.

“Yes, Texas has always been hot, but climate change is causing more extreme heat,” Austin Mayor Kirk Watson said.

Nielsen-Gammon’s team plans to speak to state lawmakers about likely impacts the climate trends will have on the state’s power grid over the next several months. That hearing before the Texas House State Affairs Committee starts at 9 a.m. at the Texas Capitol on Monday, June 10.

Solar is the future


NextEra is one of the largest owners of gas fired power plants in the US.
When asked this week if gas or renewables will meet the country’s growing electricity demand – their CEO answered thusly:
——–
The CEO said he expects an almost 40% rise in US power demand over the next two decades, compared with just 9% over the previous 20 years. Renewable energy will meet most of the consumption boost because new gas-fired plants are much more expensive, take too long to connect to the grid and have to be supplied by hard-to-build gas pipelines, he said.
He said that adding battery storage to wind and solar farms can make those carbon-free sources almost as reliable in providing around-the-clock power as fossil fuels are.
“If I want to pay double, I can go with a gas-fired plant,” Ketchum said.
 

Tech Firms Ask NextEra for Enough Electricity to Power Entire Cities

NextEra Energy Inc

Deforestation and climate change


The Rainforest Alliance explains how deforestation affects climate change and the innovative approach we take to maintain forests.

Forests offer many valuable gifts, including a crucial one: aiding in the effort to slow climate change. Trees play a vital role in capturing greenhouse gases (GHGs), such as carbon dioxide, which are responsible for warming our planet. However, when we clear forests, we not only lose our most effective ally in reducing the enormous amount of GHGs produced by human activities like burning fossil fuels in energy facilities and transportation. We also contribute to emissions by cutting down trees, which releases all the stored carbon into the atmosphere. Whether the felled trees are left to decompose or burned, it results in additional emissions. Overall, deforestation is responsible for around 10 percent of global emissions.

Deforestation robs us of a vital weapon in fighting climate change – and creates additional greenhouse gases – so why on Earth would anyone clear a forest? The main reason is agriculture. With an exploding population, big business is razing forests to plant mega crops like soy and oil palm; while on a much smaller scale, subsistence farmers often clear trees to plant crops to feed their families and make a small profit.

In spite of this, clearing rainforests for agriculture has a tragic irony: the soils beneath them are terrible. Once the forests are burned and their ashes are exhausted, farmers are left with completely useless soil because all the nutrients are locked up in them. Agricultural activity accounts for 80 percent of tropical deforestation, so they raze, plant, deplete, and repeat.

It’s no surprise that agriculture contributes to emissions; in fact, farm emissions are second only to those from the energy sector. In 2011, they made up about 13 percent of global emissions. These mainly come from methane (produced by cattle) and nitrous oxide (from fertilizers). When we look at deforestation, it becomes clear that it has a threefold impact on global warming: first, we lose a crucial carbon sink; second, felled trees release stored carbon as they decompose or are burned; and third, the replacement of forests with livestock and crops produces even more greenhouse gases. In total, these emissions account for a quarter of all global emissions.

Our analysis of the negative effects of deforestation solely focuses on emissions and does not even address the devastation that is inflicted upon forest communities or the loss of numerous plant and animal species, which disturbs the delicate balance of ecosystems. The consequences of deforestation and global warming also indirectly lead to an increase in mosquito-borne diseases and the rapid spread of Roya, a harmful plant ailment that poses a threat to our coffee supply. It is indisputable that preserving forests is crucial in combating climate change. However, with a rapidly growing global population expected to reach 9 billion by 2050, there is an urgent need to meet the demand for food. This is why at the Rainforest Alliance, we collaborate with farmers to implement various strategies like crop intensification, as well as support traditional forest-dwellers in establishing sustainable livelihoods that do not harm forests or ecosystems. With forests remaining intact, we have a better chance of succeeding in this battle.

Solar generation outpaced that of coal in ERCOT

  For the first time in Texas, in March solar generation outpaced that of coal in ERCOT, at over 10% of the generation mix. While wind hit this mark several years ago, this is a first for solar and will become a permanent fixture as the growth of solar continues to boom in ERCOT.

  Texas is quickly becoming the clean energy capital of the US, and it is being driven not by top-down regulated energy policy, but by economics and making it easy for private companies to permit, interconnect, and build projects.

They’re [Texas] an outlier in one way and that’s really on the regulatory side. The reason Texas is now leading the country is that it makes it easy to build and to connect new, renewable or any energy projects in the state while a lot of other states carry out protracted study requirements and other regulatory hurdles

[Vice President of General Economics at the Cato Institute Scott Lincicome] said. “As a result, new power generation comes online in Texas in about half the time it takes elsewhere.”

Texas power prices briefly soar 1,600% as a spring heat wave drives record demand for energy

Hotter temperatures in Texas are expected to set new all-time highs for energy use in the month of May, sending electricity prices spiking higher.

The state’s grid operator, the Electric Reliability Council of Texas (ERCOT), predicted demand would jump from 57,486 megawatts on Friday to 71,893 MW on Monday, 72,725 MW on Tuesday, and 74,346 MW on May 24, according to Reuters.

The coming week could see demand topple the current record for May of 71,645 MW set in 2022, while still trailing the all-time high of 85,508 MW set on Aug. 10, 2023.

That’s as weather forecasts for top cities like Houston and Dallas have put high temperatures in the 90s, above seasonal norms, meaning more Texans will crank up their air conditioning.

Expectations for the latest demand surge boosted electricity prices in the spot market, with next-day prices in ERCOT’s north hub soaring to $120 per megawatt hour MWh for Friday from $40 for Thursday, according to LSEG pricing data cited by Reuters.

And for about one hour late Friday, day-ahead prices on ERCOT’s website jumped as high as $688 per MWh, representing an increase of more than 1,600% compared to the prior day.

The Texas power market is deregulated and on its own electricity grid. But the actual price that consumers pay depends on the type of contract they have with their provider. And since February 2021, energy providers have been barred from fully passing along wholesale electricity prices to their residential customers.

Brutal heat waves over recent summers have shattered records for power demand, sending spot prices on wild, sudden swings. In September, Texas power prices surged as much as 20,000%.

Meanwhile, Texas has seen an influx of residents since the pandemic as people fled states like California and New York, where the cost of living is higher, meaning more customers are plugged into the grid.

Texas has also become a hotbed for bitcoin mining, adding to electricity demand, as the state’s deregulated power market and abundance of cheap natural gas became attractive to the energy-intensive sector. The proliferation of data centers and the rise of artificial intelligence technology has also boosted demand.

This story was originally featured on Fortune.com

Solar was almost 100% of new electrical capacity added in the US in March

 A review by the SUN DAY Campaign of data just released by the Federal Energy Regulatory Commission (FERC) reveals that solar provided 86.8% of all new capacity in the first quarter of 2024. In March alone, solar accounted for 99.7% of capacity added, marking the seventh month in a row in which it provided more new U.S. electrical generating capacity than any other energy source.

Solar was nearly 100% of new capacity in March

In its latest monthly “Energy Infrastructure Update” report (with data through March 31, 2024), FERC says 52 “units” of solar provided 2,833 MW of new domestic generating capacity in March or 99.72% of the total. The balance consisted of 3 MW each of new biomass and oil capacity plus 1 MW each of new hydropower and natural gas capacity.

For the first quarter of this year, solar accounted for 86.79% (or 6,497-MW) of new generating capacity brought online while wind contributed another 12.40% (928-MW). Natural gas trailed with only 49 MW (0.65%) accompanied by 5 MW of oil, 3 MW of biomass, 3 MW of “other,” and 1 MW of hydropower.

Solar has now been the largest source of new generating capacity for seven months straight: September 2023 to March 2024. Further, new solar capacity added in the first quarter of 2024 was more than double the solar added in the first quarter of 2023 (2,774 MW).

Solar is now in fourth place for its share of U.S. generating capacity

The latest capacity additions have brought solar’s share of total available installed utility-scale (i.e., >1-MW) generating capacity up to 8.25%, surpassing that of hydropower (7.88%). Wind is currently at 11.77%. Solar and wind combined now account for more than a fifth (20.02%) of the nation’s installed utility-scale generating capacity. With the inclusion of biomass (1.14%) and geothermal (0.33%), renewables now claim a 29.37% share of total U.S. utility-scale generating capacity.

For perspective, just a year ago, solar’s share was 6.67%, while wind and hydropower were 11.51% and 7.97% respectively. The mix of all renewables totaled 27.67%.

Installed utility-scale solar has now moved into fourth place — behind natural gas (43.79%), coal (15.87%) and wind — for its share of generating capacity after having recently surpassed that of nuclear power (8.01%).

Solar on track to surpass the individual capacities of wind and coal within three years

FERC reports that net “high probability” additions of solar between April 2024 and March 2027 total 89,030 MW — an amount more than three and one-half times the forecast net “high probability” additions for wind (24,483-MW), the second fastest-growing resource.

FERC also foresees growth for hydropower (568-MW), geothermal (400-MW) and biomass (91-MW). The new 1,100-MW Vogtle-4 reactor in Georgia — which entered commercial operation in late April – will increase nuclear capacity modestly while coal, natural gas and oil are projected to contract by 20,077 MW, 2,386 MW, and 2,015 MW respectively.

If just FERC’s current “high probability” additions materialize, by April 1, 2027, solar will account for almost one-seventh (14.16%) of the nation’s installed utility-scale generating capacity. That would be greater than either coal (13.36%) or wind (12.77%) and nearly double that of either nuclear power (7.56%) or hydropower (7.40%).

The mix of all renewables would account for 35.73% of total available installed utility-scale generating capacity — rapidly approaching that of natural gas (40.72%) — with solar and wind constituting more than three-quarters of the installed utility-scale renewable energy capacity. Solar capacity alone would equal the combined capacities of wind, biomass and geothermal.

FERC’s “high probability” numbers for utility-scale solar as well as wind will almost certainly prove to be too conservative. In its March 2021 “Infrastructure” report, FERC projected that between April 2021 and March 2024, net “high probability” solar additions would total 41,238 MW, while those for wind would reach 21,888 MW. In reality, solar additions during that three-year period totaled 49,480 MW — i.e., almost a fifth (19.99%) higher while actual wind capacity additions reached 26,910 MW or nearly 23% greater than FERC’s forecast.

Moreover, FERC reports that there may actually be as much as 214,882 MW of net new solar additions in the current three-year pipeline in addition to 73,732 MW of new wind and 7,719 MW of new hydropower.

In addition, inasmuch as FERC only reports data for utility-scale facilities, its data do not reflect the capacity of distributed renewables, notably rooftop solar PV. According to the U.S. Energy Information Administration (EIA), small-scale solar PV is estimated to account for nearly a third of the nation’s electrical generation by solar and a larger share of total installed solar capacity.

This suggests that the total capacity of distributed and utility-scale solar combined is significantly more than the 8.25% FERC reported as solar’s share of total capacity at the end of March. It is perhaps closer to 12.0% and may be on track to approach or exceed 20.0% within three years.

That, in turn, could also bring the generating capacity provided by the mix of all renewables close to – or even surpass — that of natural gas within three years.

“FERC’s data for the first quarter seem to confirm forecasts by multiple sources that solar will dominate new capacity additions in 2024,” noted the SUN DAY Campaign’s executive director Ken Bossong. “And it is not unreasonable to suggest that solar’s growth this year will exceed expectations.”

 | 

solarpowerworld

Net metering vs. Net billing explained

Ideally, your home’s solar system would perfectly match your electricity needs – no more and no less. However, there are times when the panels will generate more power than you consume (such as during sunny summer days), and other times when they may not generate enough (like on shorter or cloudier days and nights). This is where Net Metering and Net Billing come into play. These systems allow you to use the grid as storage, trading in any excess energy your panels produce for credits on your bill. Then, when your solar system can’t keep up with your electricity needs and you must rely on the grid, these credits can be used to offset the cost.

Net metering and net billing compensation structures, types of net metering and net billing, and where these programs are available nationwide are discussed in this article.

Net metering vs. Net billing

It is important to remember that net metering and net billing aren’t synonymous, despite their similarities. Depending on how participants are compensated, both programs compensate solar owners for transferring electricity to the grid when their panels overproduce. Generally, net metering credits equal the retail electricity rate (what you pay for electricity as a utility customer). On the other hand, net billing credits are equal to wholesale rates (what your utility company pays for electricity)

Net metering

Net metering allows you to receive bill credits, but the exchange is not typically in the form of money. Instead, these credits are stored and can be used when needed on overcast days. They can be carried over each month and have a one-to-one ratio with grid-produced electricity, meaning your solar panels’ output is equivalent to that of the grid. This simplifies your energy bill as you are only charged for your net usage, or consumption minus production. Net metering programs are a valuable method for solar owners to “store” their excess energy, making home solar systems even more beneficial. However, utility companies argue that since retail prices include business costs in addition to electricity value, net metering credits exceed the value of electricity and delivery.

Net billing

In net billing programs, you can sell excess energy generated by your solar panels to the utility, typically at wholesale prices, instead of “banking” the credits. Net billing is a monetary exchange in which the energy generated by your home solar system is treated like that of a large-scale solar project. However, with net billing, you will typically receive a lower compensation rate than with net metering.
Types of solar compensation programs

Types of solar compensation programs vary from state to state and utility to utility. As the renewables industry has grown and matured, different types of net metering and billing programs have emerged.

Retail net metering

One commonly used approach is retail net metering, where individuals are credited at the retail electricity rate for the energy generated by their solar panels. This can boost the worth of residential solar systems but may lower utility companies’ profits. Retail rates often encompass more than just energy expenses, with a portion being allocated to cover utility staff, maintenance, and other costs. Due to this, several utility companies are advocating for revisions to net metering policies that would offer significantly lower compensation rates for solar system owners.

Virtual net metering

Virtual net metering, also known as shared net metering, has advantages for those involved in collective renewable energy initiatives such as community solar. This system provides the same monetary reimbursement as traditional net metering, but with the added convenience of not needing the solar panels to be situated on the participants’ own properties. Instead, community solar members are typically assigned a share of a larger solar installation. If their designated portion generates surplus electricity that goes back into the grid, they will receive equal compensation through virtual net metering as if those panels were installed on their own roof.

Avoided-cost

Bill credits for avoided-cost bills differ from most retail net metering programs in that they do not correspond to a one-to-one compensation arrangement. In place of providing electricity to their homes, participants receive credits equal to the utility cost saved. As avoided-cost rates do not involve a one-to-one exchange, they can be categorized as net billing rather than net metering since they are monetary and not a one-to-one exchange.

Where can one find net metering and net billing programs?

Utilities have a tendency to resist net metering programs, and policies at the state and local level are subject to change. As previously stated, these compensation structures differ from one state or utility to another. For instance, Idaho and Texas do not require net metering, but some utilities may still provide it. To determine the specific programs offered in your area by your utility, it is advisable to seek advice from a reliable installer in your vicinity.

Some important points to remember are about net metering and net billing programs. These programs allow excess energy produced by home solar systems to be transferred to the grid, resulting in credits for the homeowner. The value of these credits is often based on the retail rate of electricity, but can also be lower depending on the program. As utilities often object to net metering, other compensation options are gaining popularity.

KEY TAKEAWAYS

  • Net metering and net billing programs use overproduced electricity from home solar systems by transferring the excess energy to the grid. You receive credits for this energy you send to the grid in exchange.
  • Net metering transactions are usually one-to-one, so the credits are often equal to the retail rate of electricity (aka what you pay).
  • Net billing credits are often equal to the wholesale rate of electricity (aka what your utility pays), which is less than the retail rate.
  • Utilities tend to oppose net metering programs, so alternative compensation programs are becoming increasingly popular.
  • Incentive and compensation programs like net metering and net billing increase the value of solar panel systems .

The fastest energy change in history

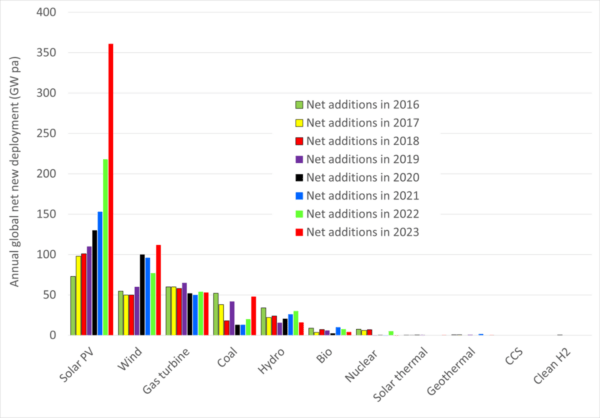
  Solar photovoltaics and wind contributed about 80% of global net generation capacity additions in 2023; four times as much new solar and wind electricity generation capacity was added as compared to all other sources.

Approximately 80% of net addition to global net generation capacity will come from solar photovoltaics and wind in 2023, marking the fastest energy revolution in history. Compared to everything else combined (gas, coal, hydro, nuclear and others), four times as much new solar and wind electricity was installed in 2023. For new generation capacity, solar and wind are the best options based on market evidence.

The combined global solar installed capacity and production have surpassed 1.4 TW and 1.7 TW, respectively, which is more than ten times higher compared to a decade ago and doubling every three years. Solar capacity is being installed faster than any other source in history, surpassing nuclear in 2017, wind in 2022, and hydropower last year; it is expected to surpass fossil gas in 2024. At an annual growth rate of 20%, solar is on track to become the largest contributor to global generation capacity by overtaking coal in 2025 and reaching a total of 9 TW by 2031, exceeding all other sources combined. 

This rapid and sustained expansion of solar and wind generation indicates their potential dominance in meeting the ever-increasing demand for electricity due to rising affluence, population growth, and the trend towards electrification of various functions. As more functions are electrified through the use of electric vehicles, heat pumps, furnaces, and electrolysis of water for hydrogen production used in chemical processes such as metal reduction, ammonia synthesis, fertilizer production, plastics manufacturing as well as synthetic jet and shipping fuels, we can expect solar and wind to eventually displace fossil fuels from most functions.